
Ask any American to name the best Halloween candy, and the argument starts before you finish the question. Seven numbers from the latest surveys and sales data settle some of those disagreements and raise a few new questions. A couple of them might even change what ends up in your trick-or-treat bowl.
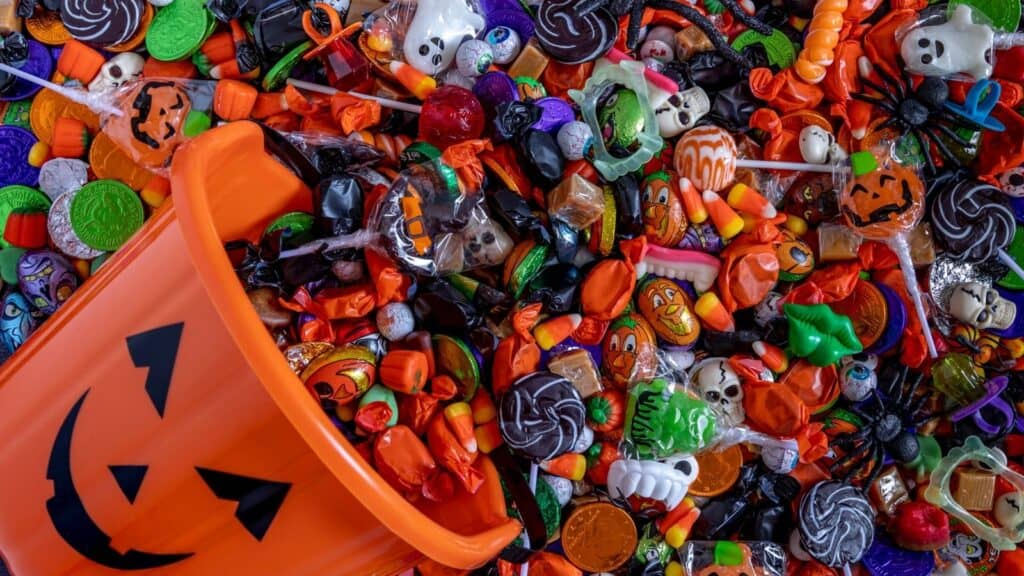
Seasonal Shapes, Colors and Flavors Appeal to 89%
NCA’s 2025 Halloween survey found that 89% of people prefer treats in seasonal shapes, colors and flavors. The same survey listed chocolate, gummy candy and candy corn among the season’s top treats. It included 1,000 U.S. adults. NCA says the group matched the U.S. population by age, income, ethnicity and region. The holiday look itself is clearly part of the appeal.
Chocolate’s Share Dropped to 44%
Chocolate lost ground in sales volume. Circana data reported by the Associated Press put chocolate at 52% of U.S. Halloween candy volume in 2024. During the 12 weeks ending in early October 2025, the share was 44%. Price may be one reason. Chocolate averaged $8.02 per pound. Non-chocolate candy averaged $5.77.
Reese’s Has the Widest Reach in Every Generation
Reese’s reaches candy buyers across age groups. Numerator’s purchase data ranked the brand first in household reach for Gen Z, Millennials, Gen X and Boomers+. Reese’s reached 65.2% of Gen Z buying households. The figure was 73.6% for Millennials, 81.8% for Gen X and 76.3% for Boomers+. These numbers cover the Reese’s brand. They do not point to one Reese’s product.
Candy Corn Orders Split Sharply by Region
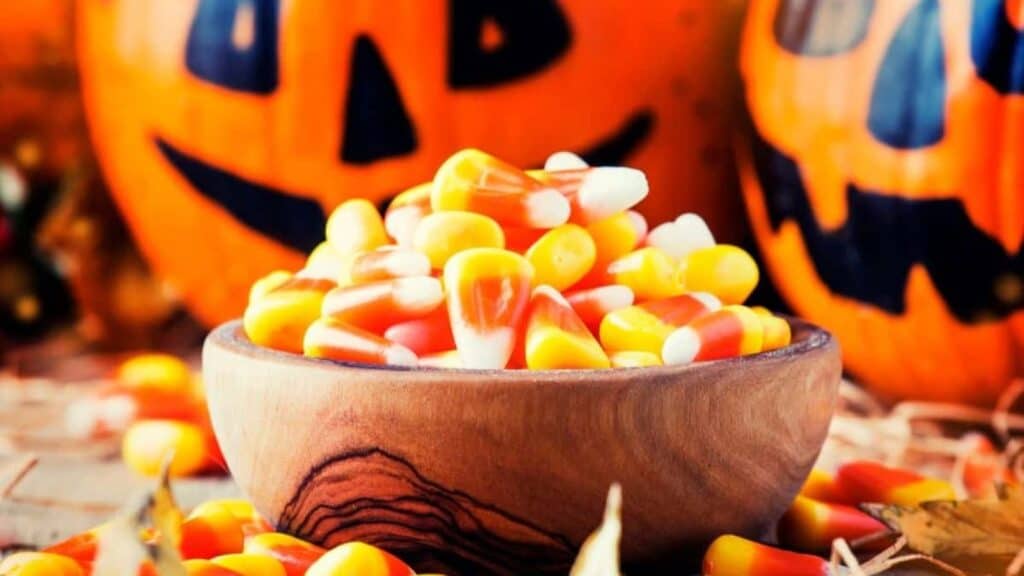
Candy corn orders vary widely by location on Instacart. Mississippi ordered it 92% more often than the national average in the company’s 2025 analysis. Nebraska was 91% above average. Kentucky was 77% above. Hawaii was 55% below average. Washington, D.C. was 50% below and Florida was 43% below. These figures reflect Instacart orders, not a poll of every resident.
One Bite Wins the Candy Corn Debate
Candy corn inspires plenty of arguments. One eating style still has a clear lead. NCA’s 2025 survey found that 58% eat the whole piece at once. Another 28% start at the narrow white end. Fifteen percent begin at the wider yellow end. Whole-piece eating wins by a wide margin.
Chocolate Still Rules Giveaway Plans
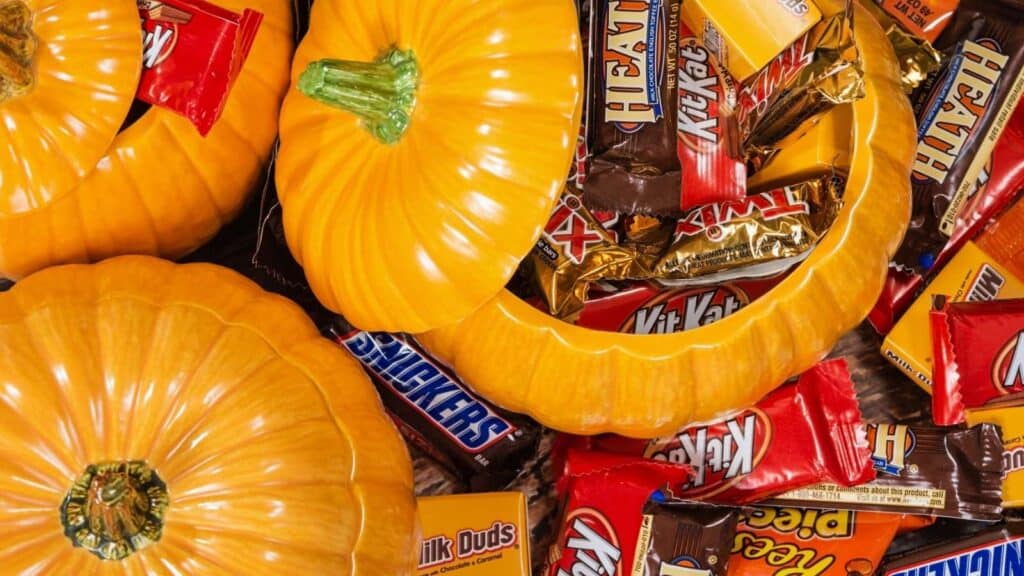
Trick-or-treat bowls lean heavily toward chocolate. Numerator found that 78% of people planning to hand out items for Halloween 2025 intended to give chocolate candy. Fruity or sour candy came next at 52%. Another 36% planned to offer other sweets. People could choose more than one type, so the figures overlap.
Halloween Candy Shopping Starts Early
Halloween candy buying does not wait for October. NCA’s 2025 survey found that one-quarter of Americans planned to buy Halloween chocolate and candy before the month began. A meaningful share of seasonal shopping therefore starts well before Halloween week.
Read the Metric Before Crowning a Winner
A candy winner is only as good as the number behind it, and these seven stats measure very different things. Surveys capture what people say they like, while purchase data shows what households actually buy. Instacart orders add a third view, but only from that platform’s customers. Check how a number was gathered before trusting the headline, and America’s sweet tooth stops looking so contradictory.